


Selling Limited VS Unlimited Risk Options Strategy Calculator with Graph
Spreadsheet for calculating risk Selling Limited Risk VS Unlimited Risk Options.
*** Digital Download: Apple Numbers and Google Sheets ***
Use the graph and chart to compare risk, return on capital and estimated simple annual return.
Check out the video demo here: Limited Risk Options VS Unlimited Risk Options Calculator Spreadsheet https://youtu.be/JOWmvqEHFzs
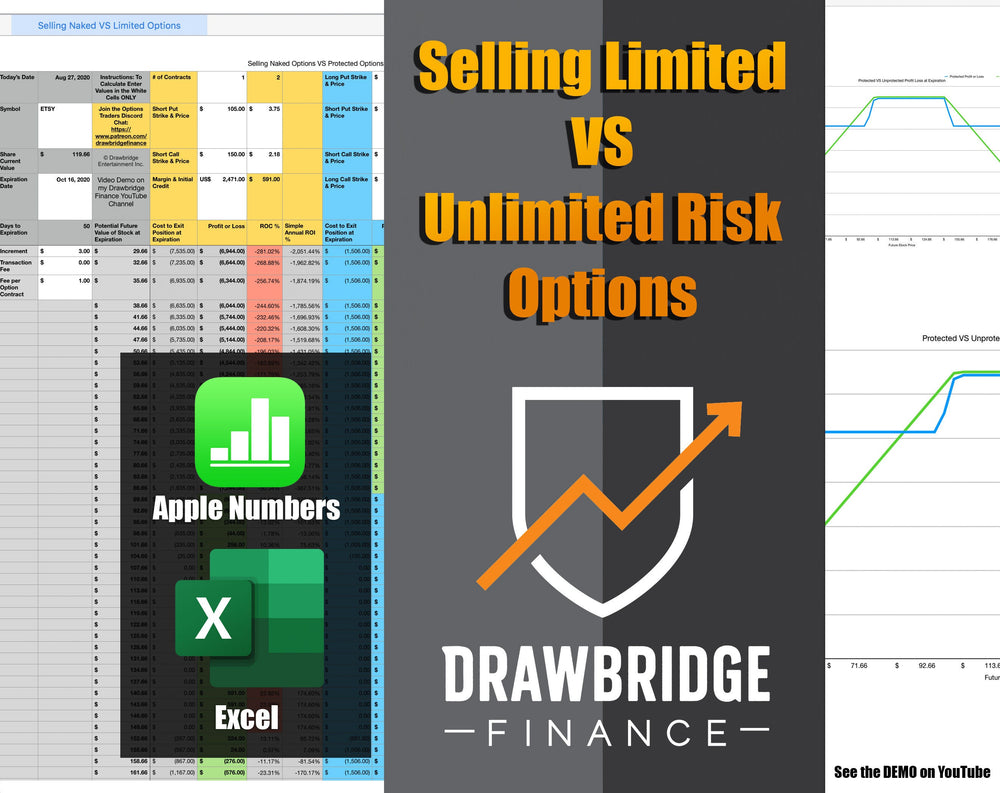
To use the chart simply enter the account fees associated with selling options, the current Stock name, Price and the Expiration of the options you want to compare.
In the yellow columns enter number of contracts, Short Strikes, current strike value and margin requirement of an unlimited loss strategy like a naked put, naked call, short strangle, short straddle.
In the blue columns, enter the number of contracts, long strikes, Short Strikes, current strike value and the margin requirement is calculated for you. (*note a copy of the spreadsheet could be made and the margin cell in the blue column could be entered manually to override the margin calculation to assess strategies like jade lizards)
The blue column is suitable for selling limited risk options strategies that begin with a net credit like iron condors, iron butterflies, bull put spreads, and bear call spreads. The blue column can also compare unlimited loss strategies as well!
Use the graph and chart to compare risk, return on capital and estimated simple annual return.
*** Enter Values into cells that have a WHITE background colour only ***
The spreadsheet has 1 sheet: There are two versions available with this purchase. (numbers and xlsx)
Check out the video demo here: