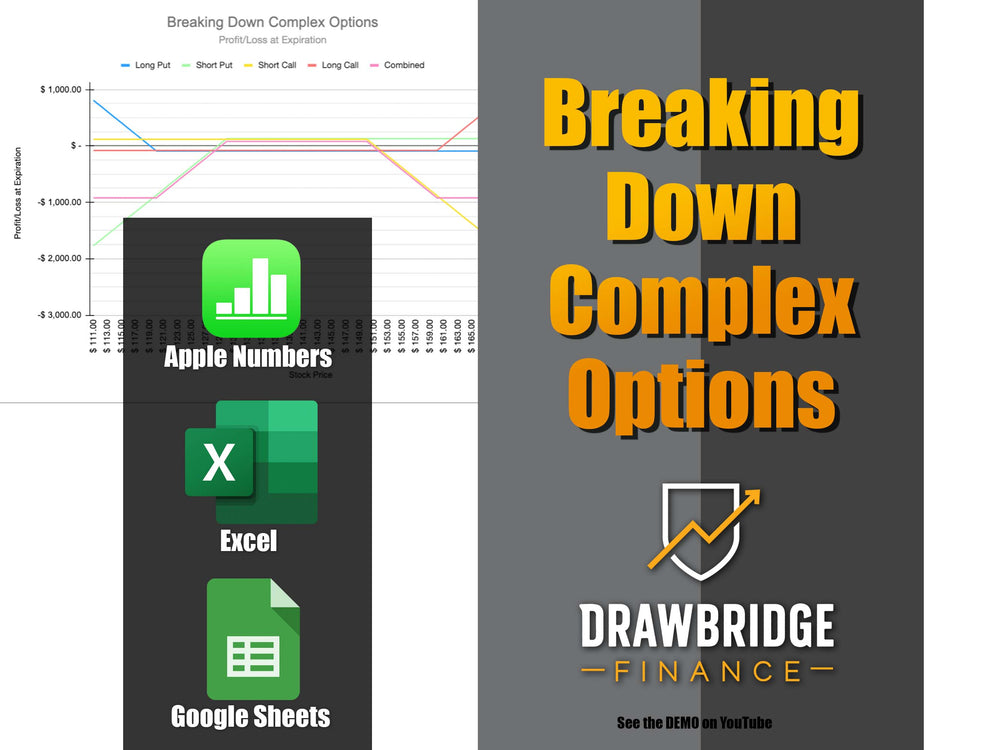


Breaking Down Complex Options with Chart and Graph
Spreadsheet Breaking Down Complex Options Strategies into the Individual Options. With video demo: https://youtu.be/hjmO0iksBro
*** Digital Download: Apple Numbers, Microsoft Excel Spreadsheet and Google Sheets Versions***
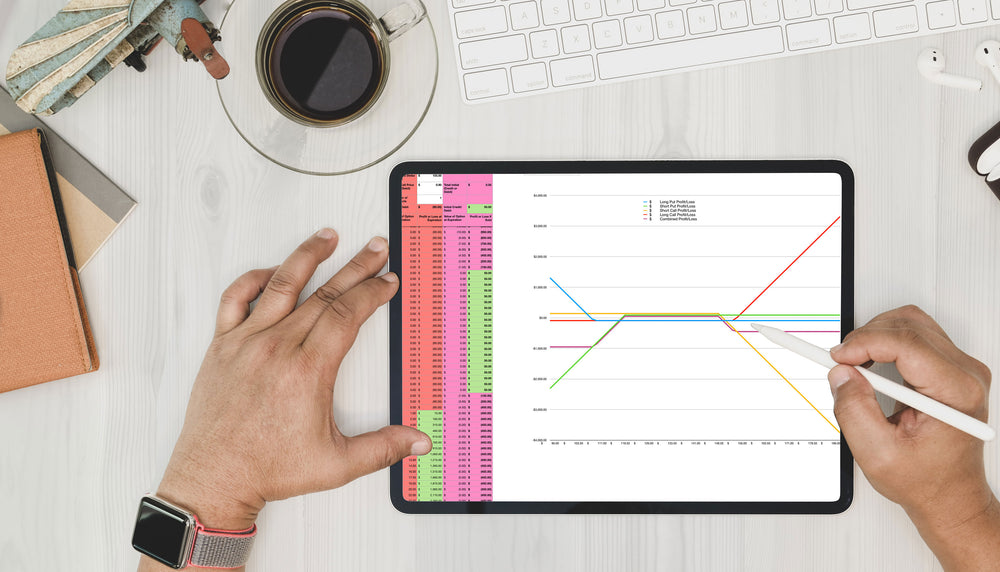
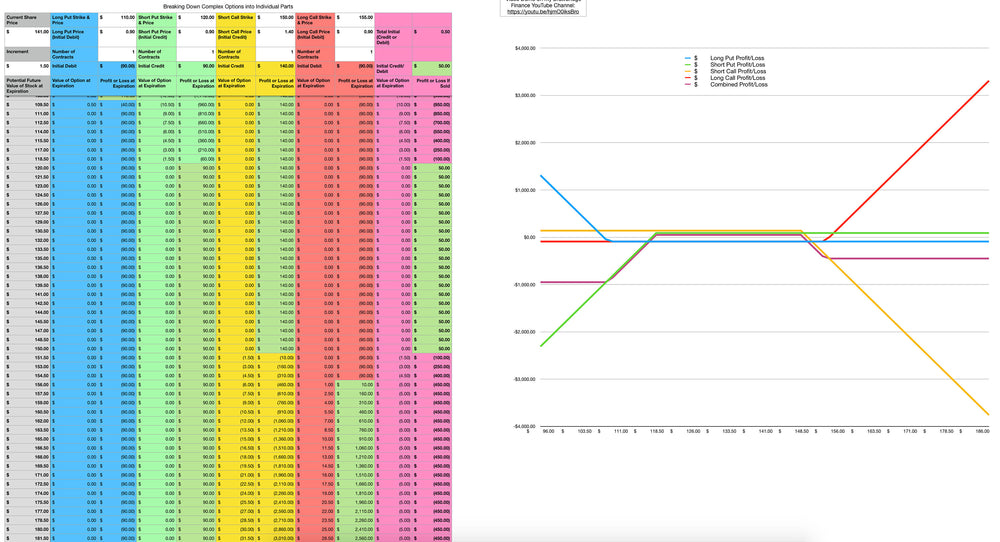
Breakdown Iron Condors, bull put spreads or any other complex strategy into the individual short put, short call, long put and long call. This allows the profit and loss to be shown in both chart and spreadsheet format so that the individual legs of each trade can be compared to the total profit loss of the entire trade.
A fantastic learning tool for advanced traders and beginners for visualizing option components.
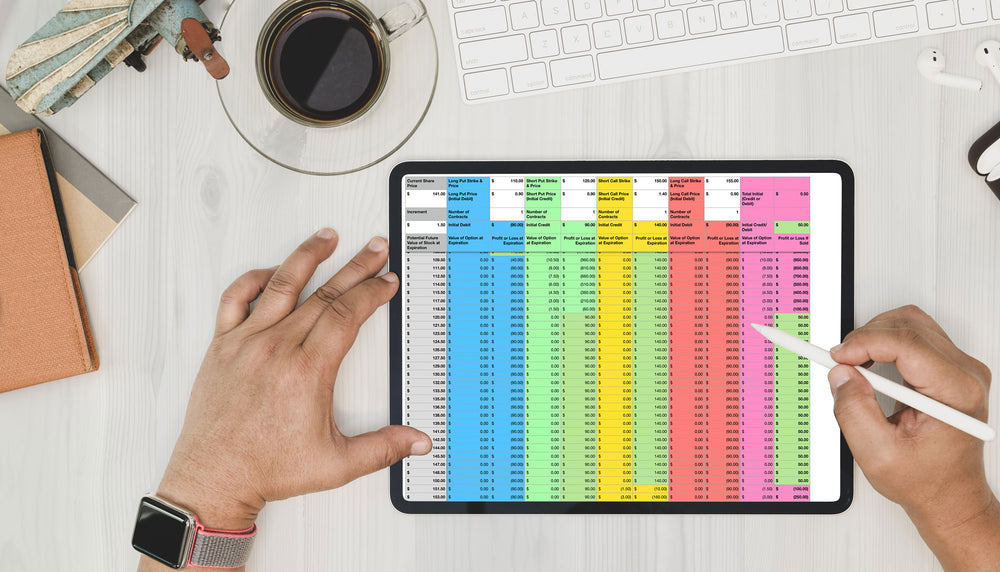
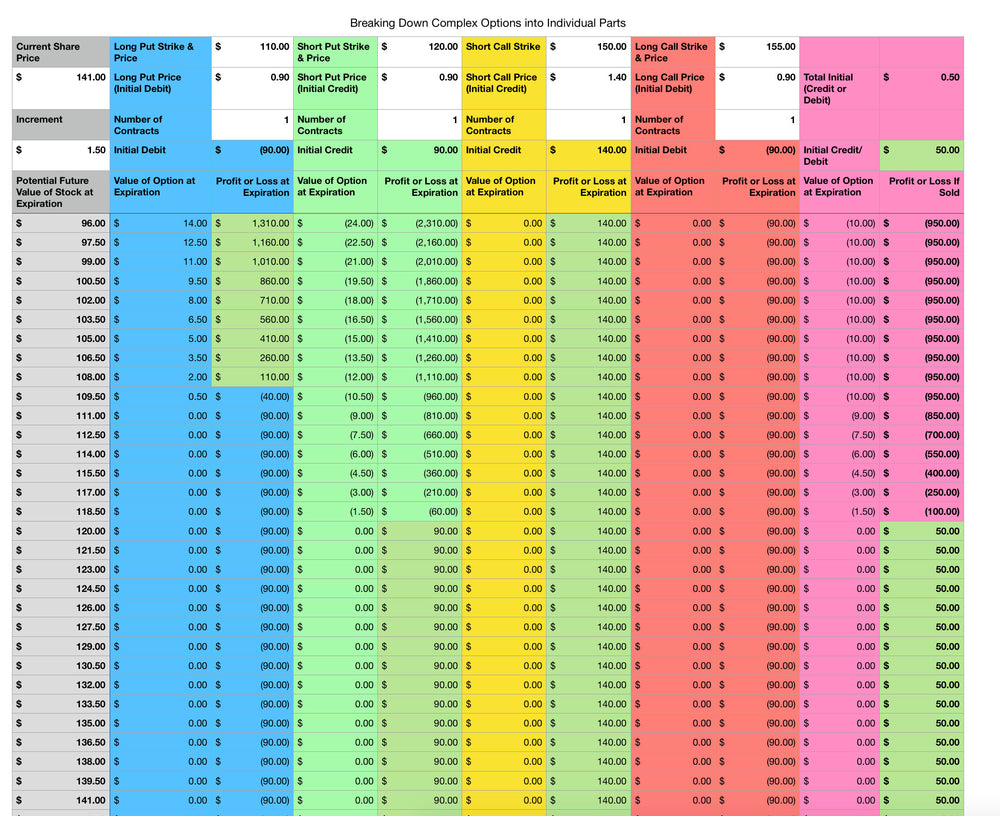
To use the chart simply enter the current Stock Price and interval for comparison of the potential future price.
There is a coloured column for each type of strategy. Fill in all three cells of one or more coloured columns to complete the chart and graph.
This can be used for comparing complex positions that start with either a debit or a credit.
Use the graph and chart to compare risk and return on capital on each individual leg of the trade.
*** Enter Values into cells that have a WHITE background colour only ***
The spreadsheet has 1 sheet: There are three versions available with this purchase. (Apple Numbers | Microsoft Excel | Google Sheets)
Check out the video demo here: